 “If you can’t measure it, you can’t manage it.”
This old adage is as true today as it was 50 years ago when the father of modern management Peter Drucker first uttered it.
The best way to start putting these wise words into practice is to set up basic Google Analytics reports that can give you invaluable insights not only into the number of people visiting your site, but more importantly, how these visitors are engaging with your site and how many of them are turning into faithful customers.
To help you brush up on your analytical skills, we’ve put together this list of essential Google Analytics reports you can’t afford to do without:
1. Audience and Site Traffic Reports
What do they tell you?
One of the most basic reports you can obtain with Google Analytics is an overview of your site traffic, including:
- Number of users: Allows you to view the number of unique visitors to your page.
- Number of sessions: Allows you to determine how many times users actively engaged with your site during the period of time selected.
- Pageviews: Total number of pages viewed
- Pages per session: Average number of pages viewed during a session
- Bounce rate: Percentage of sessions in which there was no interaction with the page
- Average session duration: Average length of a session
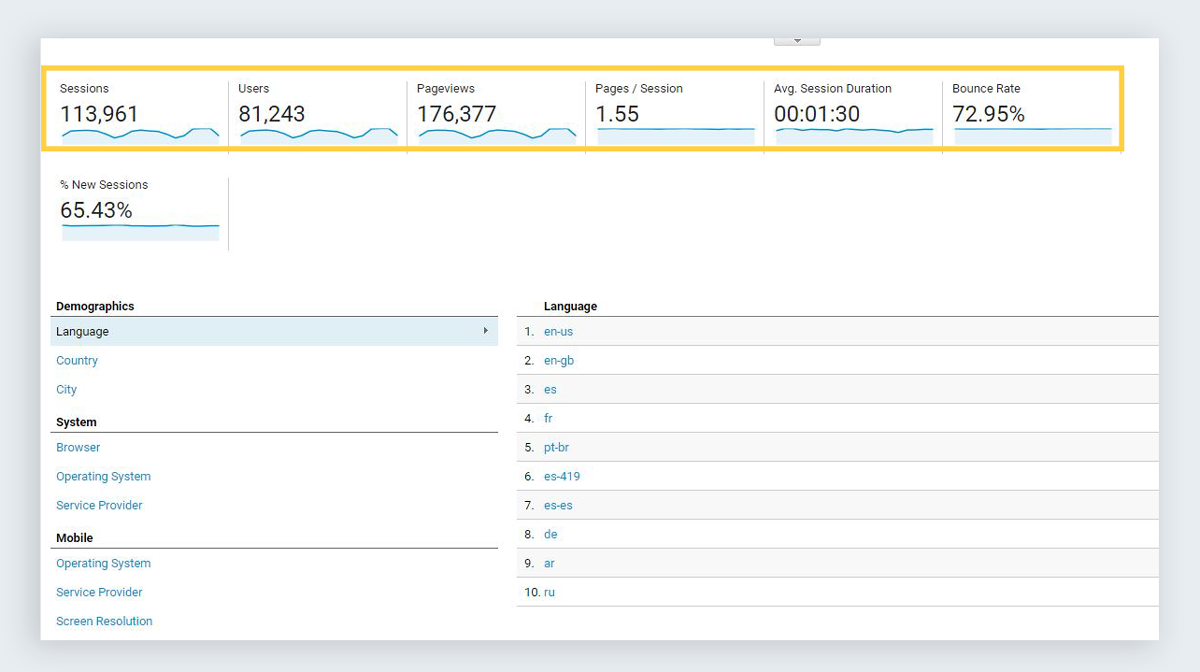
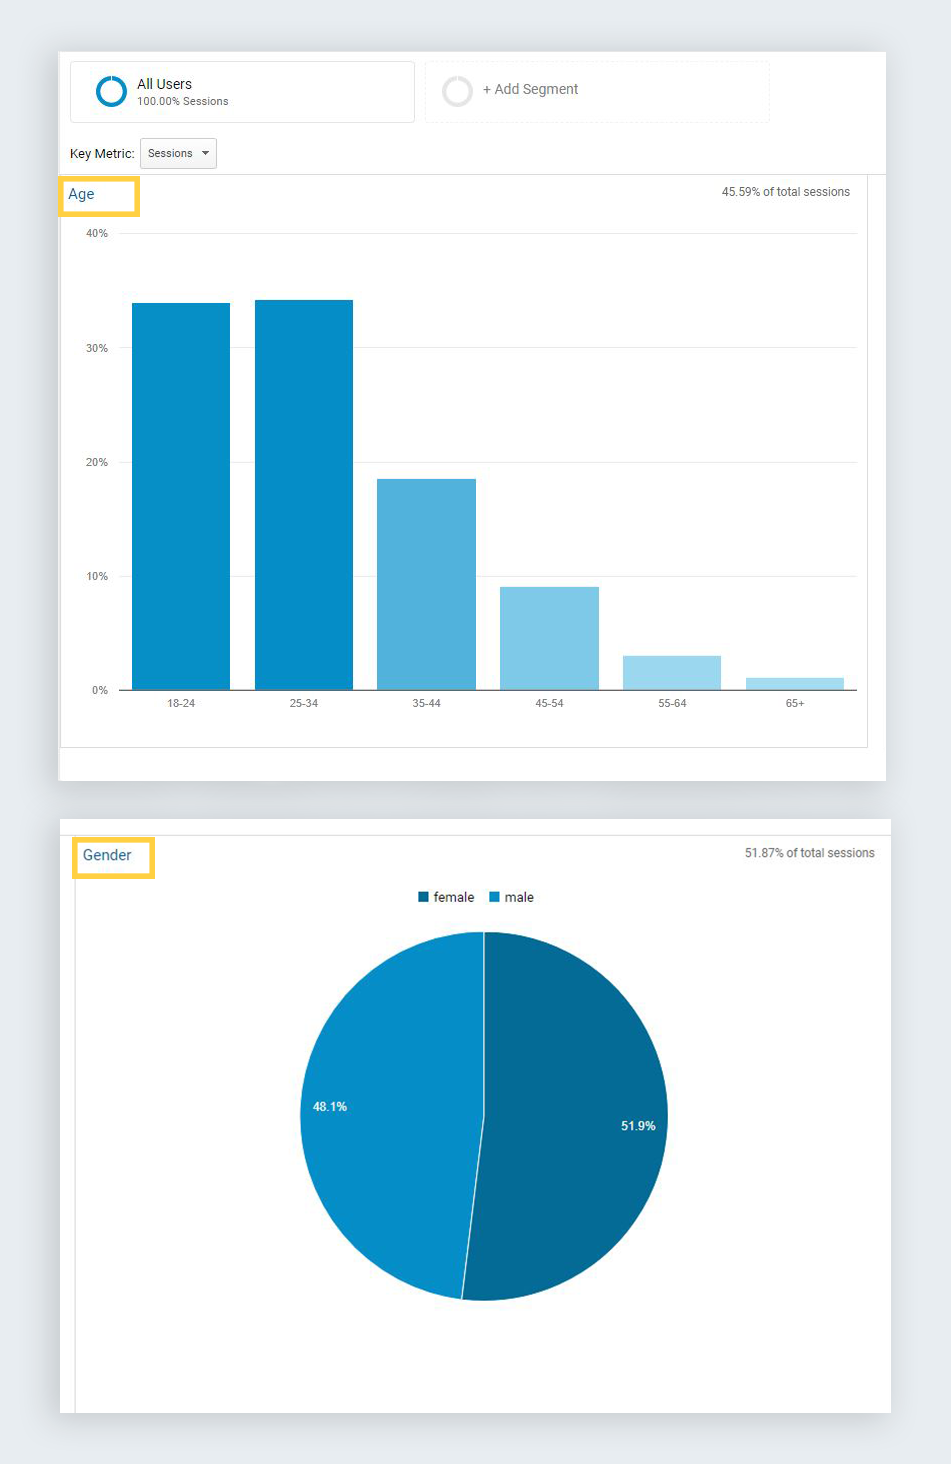
Besides essential traffic indicators, you can also access an overview of the demographics of your site visitors, such as:
- Gender
- Age
- Location
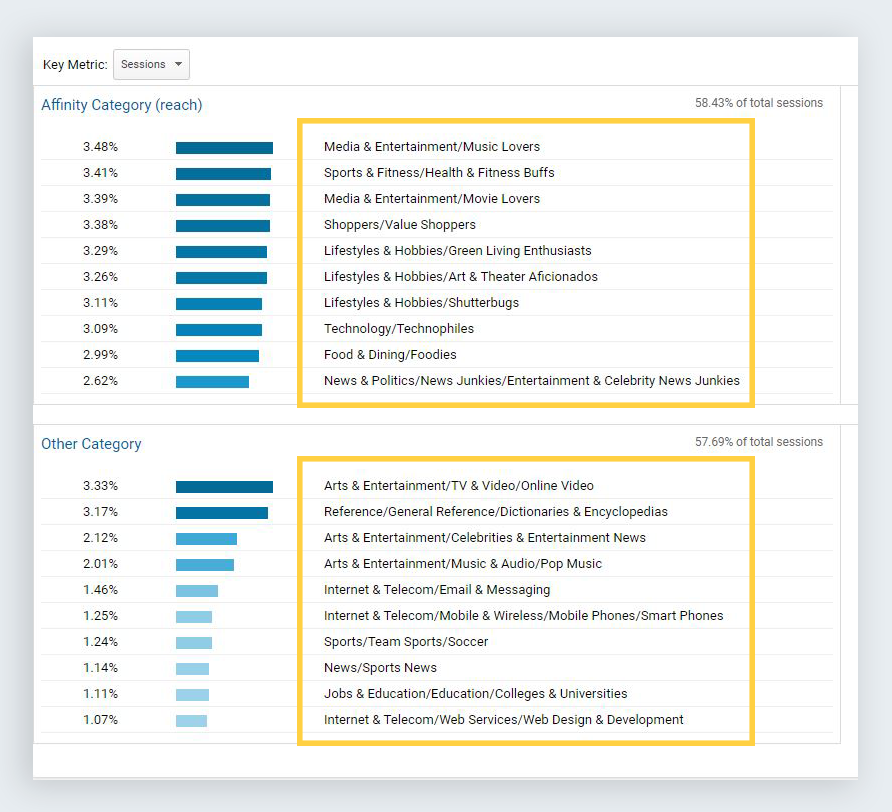
Not only that, but you can also view their consumer interests. For example, you can view what percentage of visitors are toward the end of the purchase funnel in other categories of products and services and then use this information to place retargeting ads that reach them even when they are visiting other types of pages.
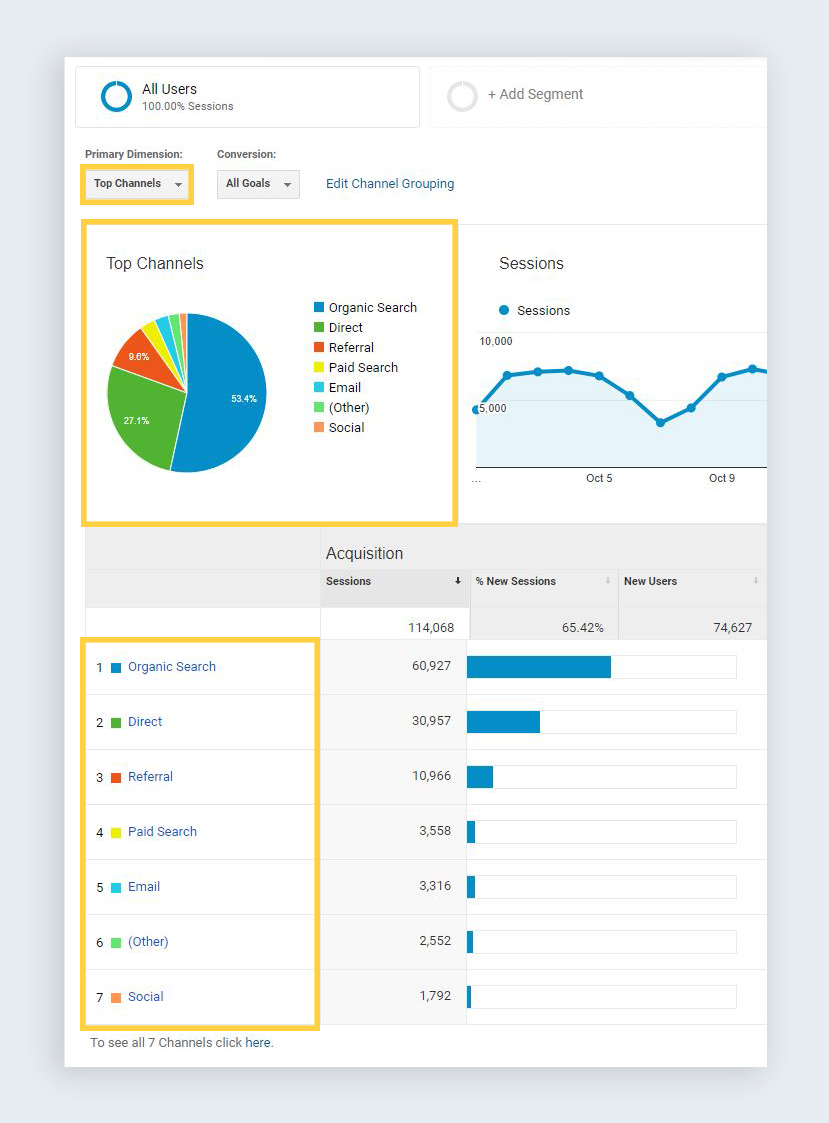
To get an overview of where your site visitors are coming from, you can also view pie charts and graphs visualizing your top channels and top sources and mediums.
How do you view them?
To obtain an audience overview report, simply go to Audience > Overview.
To see your audience demographics, go to Audience > Demographics > Overview.
To determine the location of your visitors, go to Audience > Geo > Location.
To view other consumer interests, go to Audience > Interests > Overview.
To access an overview of the source of your site traffic, go to Acquisition > Overview.
2. Visitor Behavior Reports
What do they tell you?
Now that you’ve gotten a quick overview of traffic to your site, where it’s coming from and the demographics of your visitors, you can now hone in on more specific metrics that will give you a better idea of visitor behavior on your site.
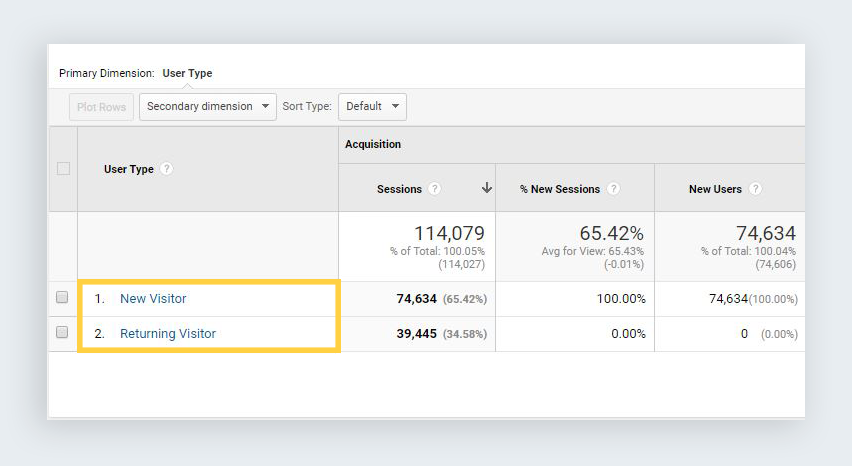
New and Returning Visitors
For example, you can compare the behavior of new and returning visitors to your site to determine which has better engagement data and adjust your marketing efforts accordingly.
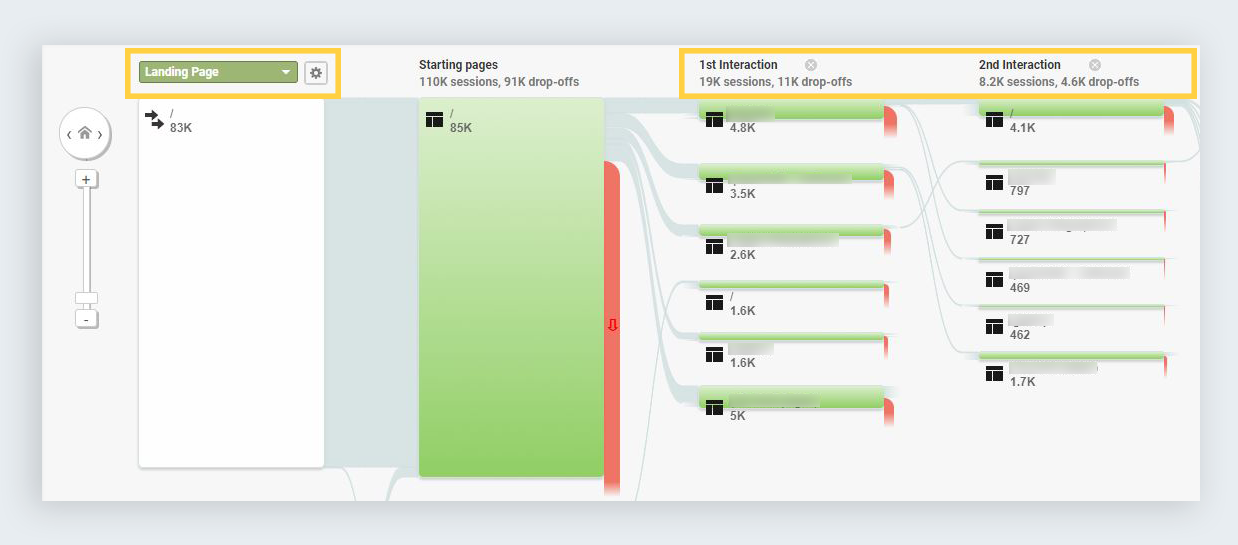
Behavior Flow
Have you ever wondered where your site visitors go after viewing your home page or a specific landing page?
You can easily access a visualization of behavior flow within Google Analytics that allows you to view the main entry point into your site (in most cases, it’s the home page) and then the subsequent pages users visit after that until they exit your site.
In the screenshot below, you can easily see where the majority of visitors first land, then their first, second and third interactions, besides the number of drop-offs at each stage.
Top-Performing Pages
To drill down deeper into the engagement data of each individual page on your site, you can also access the Pages report, which displays the number of unique pageviews, the average time on each page, the bounce rate and exit rate for each specific URL.
If you have conversion goals set up (see last section of this post), then you’ll also be able to compare how many users have completed actions such as filling out a form, purchasing a product or signing up for a service within a certain time period.
How do you view them?
To access a report on new and returning visitors, go to Audience > Behavior > New vs. Returning.
To view behavior flow, go to Behavior > Behavior Flow.
To compare pages and find your top-performing ones, go to Behavior > Site Content > Landing Pages.
3. Performance Reports
What do they tell you?
Browser and Mobile Performance Report
One of the key advantages of using Google Analytics is the ability to identify problems with your site that may be causing leaks in revenue.
For instance, you can segment your visitors by browser, device, screen resolution, operating system and even screen colors. If you have conversion goals set up (which we will cover in the next sections), you can then compare engagement data such as bounce rate, session duration and conversion rates.
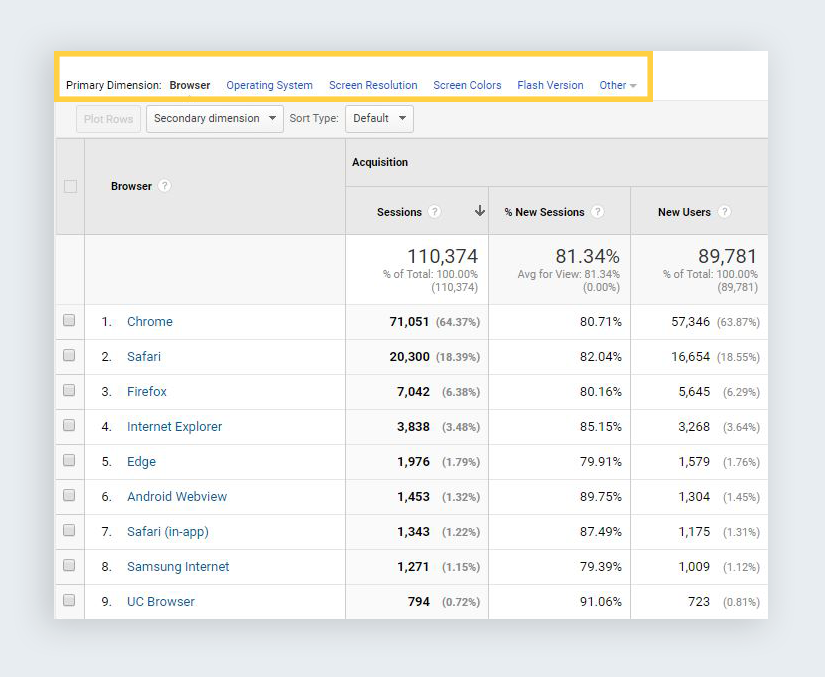
This will enable you to quickly identify red flags such as a significant difference in bounce rates between browsers on a specific type of device, indicating incompatibility issues.
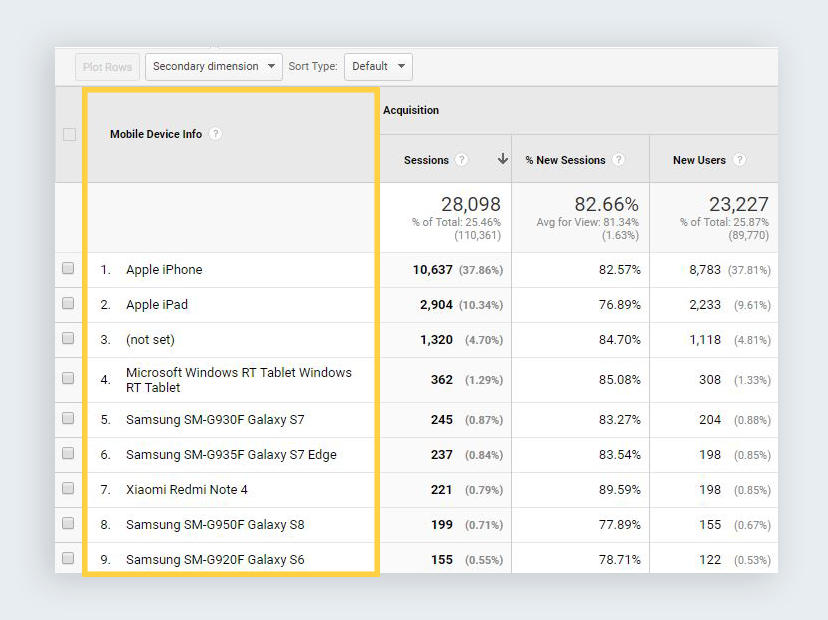
Or, you may find that certain devices or screen sizes perform significantly better than others. If this is the case, then your developers should look into these issues as soon as possible.
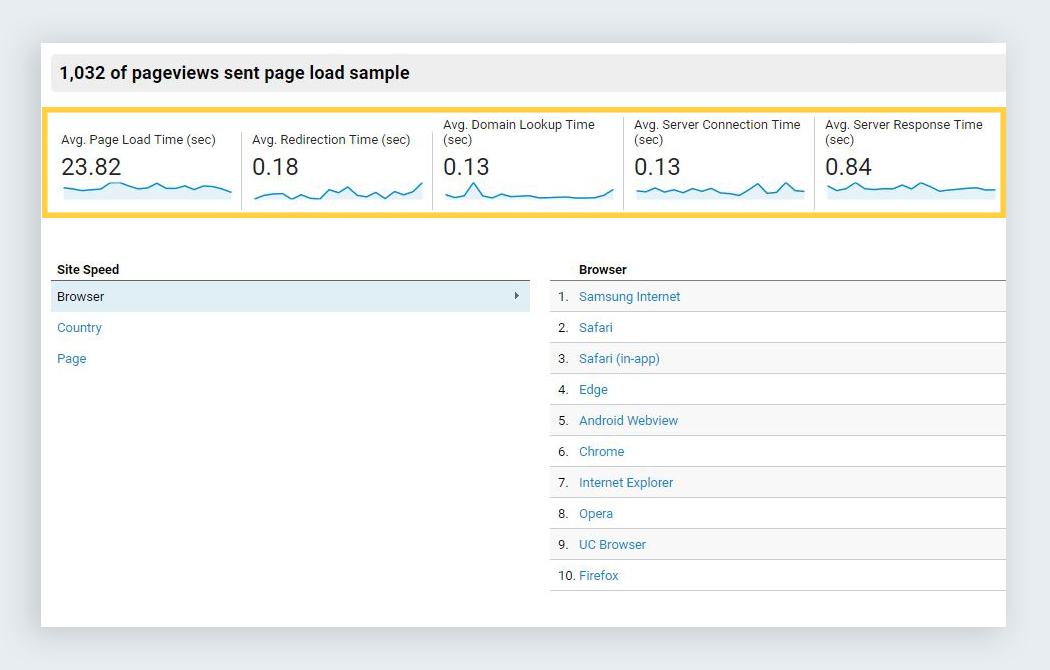
Site Speed Report
One very important report you want to take a look at is the average loading time of your pages. If your pages are taking too long to load, this is most certainly affecting visitor engagement, which will ultimately hurt your bottom line.
In Google Analytics, you can get an overview of site speed metrics, such as average page load time (overall or segmented by browser, country and page). Also, you can view other useful data such as average domain lookup time, average server connection time and average server response time.
Page Timings Comparison Report
To more easily detect slow-loading pages, you can also view a visualization of page load time compared to the site average.
In this report, you can quickly and easily spot pages that have average page loading times that are above the site average (in red) and pages that load faster than the site average (in green).
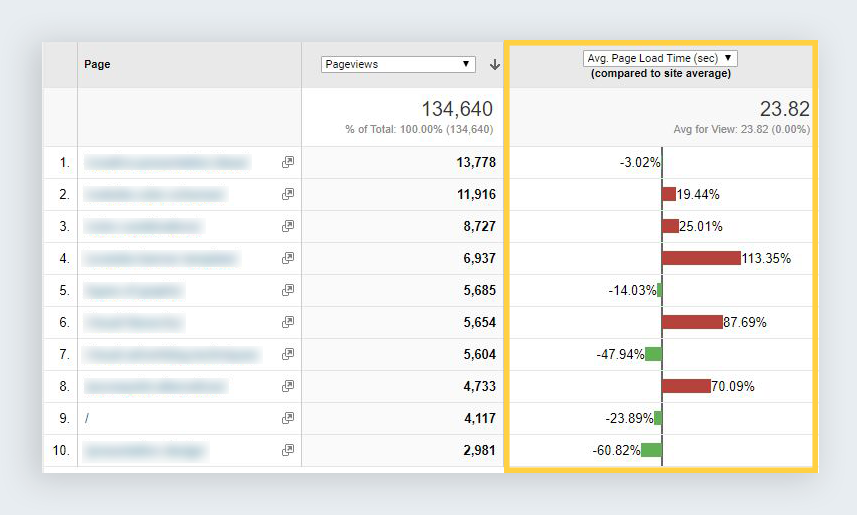
In this same report, you can also easily compare other metrics with site averages, such as pageviews, bounce rate and exit rate.
How do you view them?
To get a browser and operating system report, go to Audience > Technology > Browser & OS.
To segment and compare engagement data by devices, go to Audience > Mobile > Devices.
To access a site speed report, go to Behavior > Site Speed > Overview.
To identify pages with loading times higher than the site average, go to Behavior > Site Speed > Page Timings.
4. Conversion Reports
How to Set Up Conversion Goals
No matter how good your traffic stats look, at the end of the day what matters most to your bottom line are the total number of conversions, whether this means opting in to a mailing list, purchasing a product or signing up for a free trial.
To set up conversion goals in Google Analytics, simply go to the Admin area:
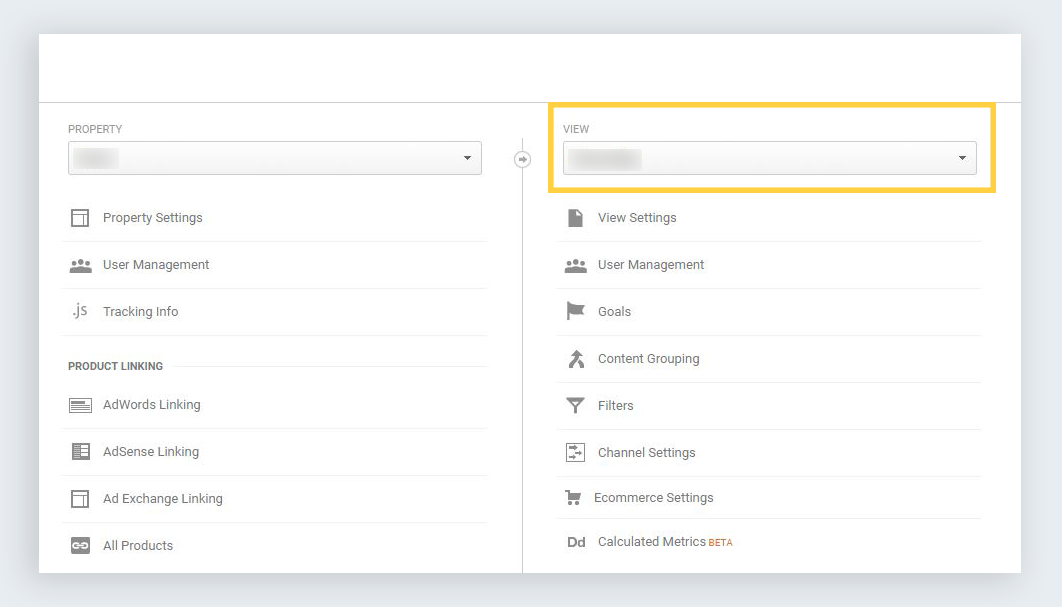
If you have multiple accounts or properties, click on the desired one and then make sure you select the desired View (which is a defined set of pages, such as your entire website or just the blog). Then click on the option Goals.
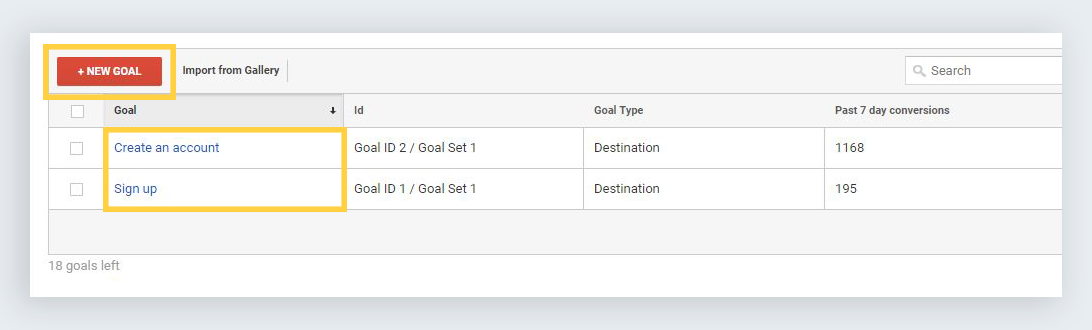
Next, click on “+New Goal” and select a template to start with. For example, if you want to measure how many people subscribe to a newsletter or join a group, then choose the “Sign up” option. Or if you want to determine how many people create an account, then click on “Create an account.”
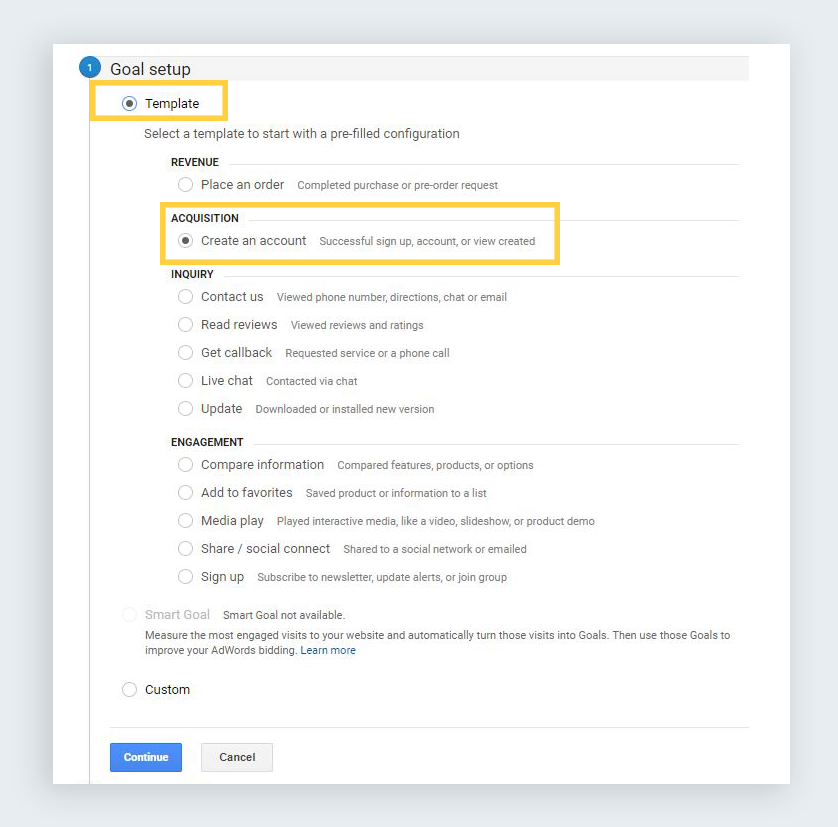
Then, choose the type of goal you want to set up. For example, if signing up for an account takes visitors to a certain URL, then choose the Destination option. Or if the goal is performing a certain action, such as playing a video, then select the Event option. Also, you can set up goals according to duration. For example, if a visitor spent more than five minutes on a page. In this case, choose the Duration option.
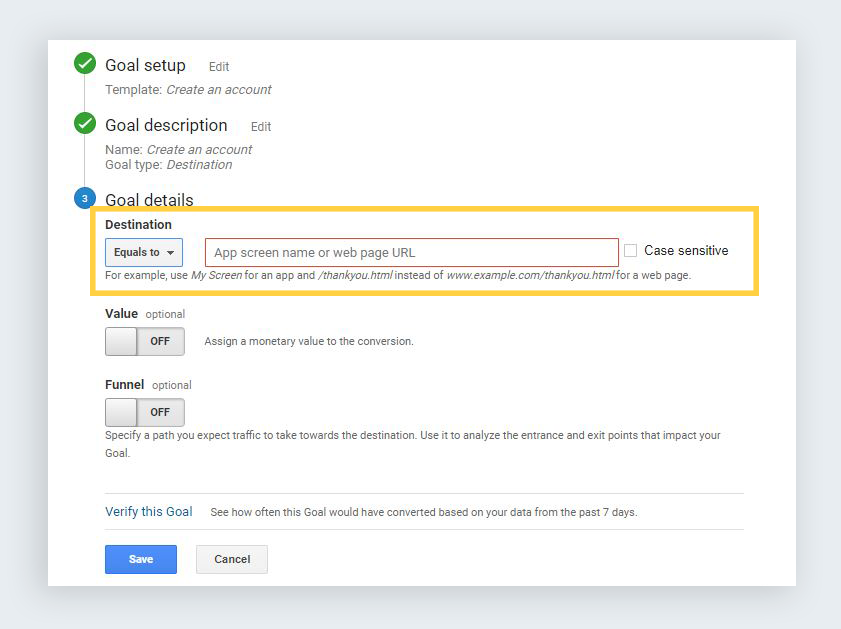
According to the option selected previously, you will then be directed to set up goal details, such as specific duration or a specific destination URL.
To make sure you’ve set up a goal properly, you can then click on the “Verify this Goal” option at the bottom of the Goal details section to view how often the goal would have converted based on your data for the past seven days. If the result is 0%, then an error has probably been made and you need to revise your goal setup.
What do they tell you?
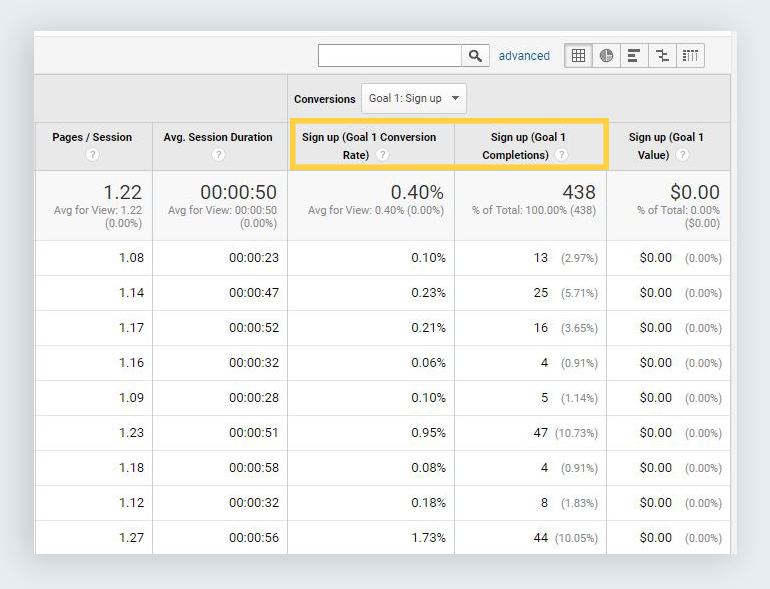
Once you’ve properly set up your goals and allowed some days or weeks for Google Analytics to collect data, you can then access an overview of goal completions.
For example, you can see the goal completion rate and the total number of visitors who completed a goal over a certain time period.
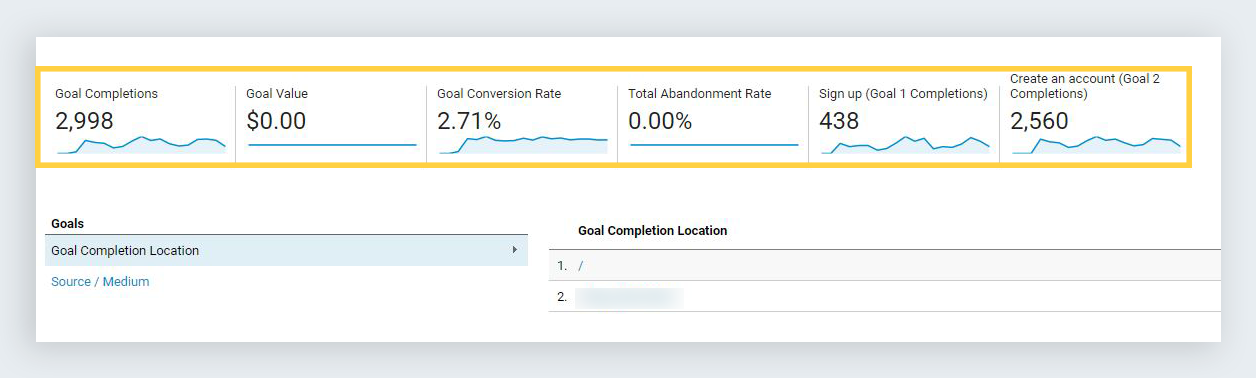
Then, you can also view the reverse goal path, which allows you to see the pages previously viewed by site visitors before completing a goal.
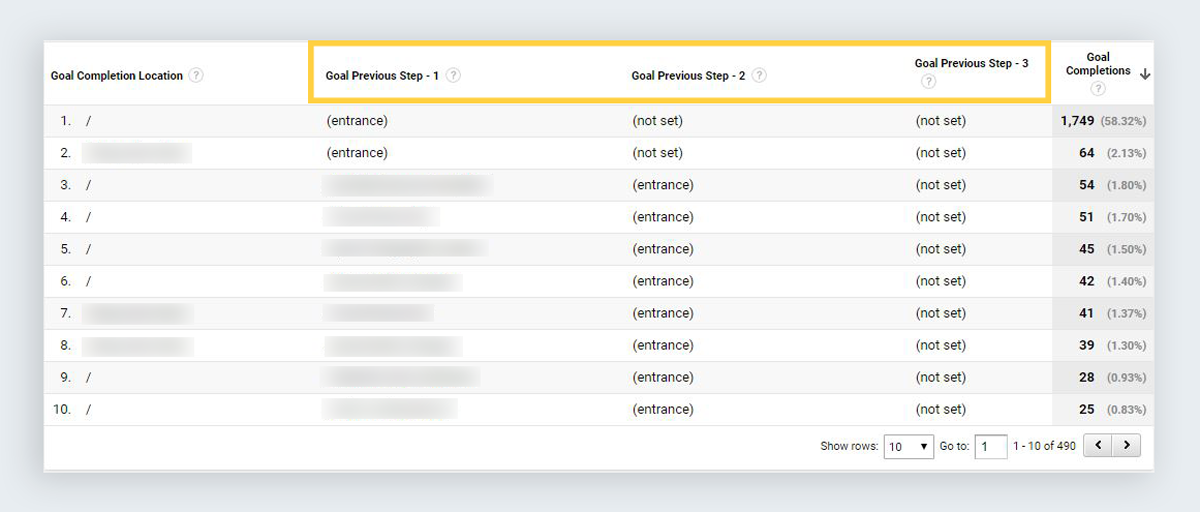
This comes in handy when you want to identify which pages are leading the most visitors to perform a specific action on your site.
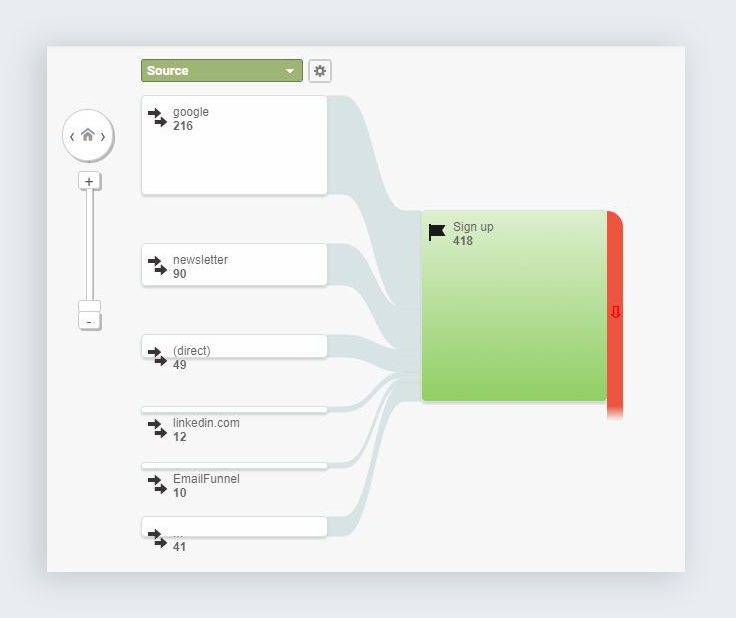
Also, if you want to find out how visitors who converted are arriving at your site, you can visualize the path users traveled towards a goal.
How do you view them?
To get an overview of goal completions, go to Conversions > Goals > Overview.
To view the reverse goal path, go to Conversions > Goals > Reverse Goal Path.
To access a goal flow report, go to Conversions > Goals > Goal Flow.
Setting Up Google Analytics
Have any questions for us? Or need help setting up Google Analytics on your site? Just drop us a line below or request a free initial consult, and we’ll get back to you.
Leave a Reply